Setting up a Project
The first thing you’ll want to do when you start using Phaedra, is setting up a new Project.
Note: to learn more about Projects, Experiments and Plates, check the Data Model section.
Creating a New Project
- In the Navigator, select Projects. The projects browser will open.
- In the top right corner of the table, click the blue + button (Create New Project)

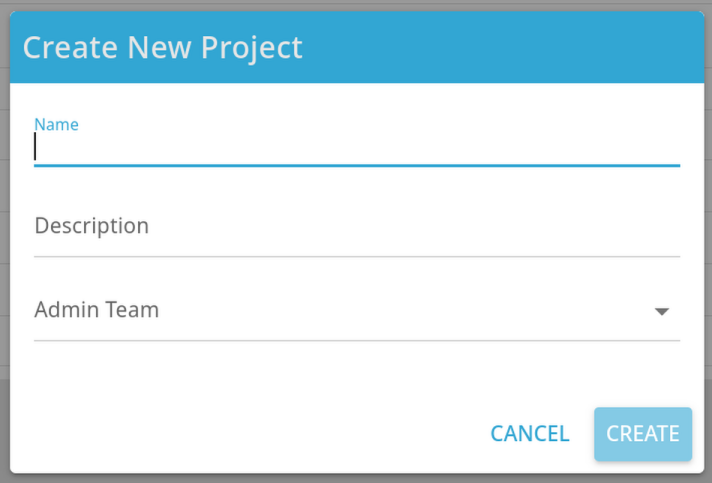
- Provide a name for the new project, and optionally a description. Also, select the team that will administer the project.
Viewing a Project
To view the contents of a project, open the Projects browser from the Navigator, and double-click on any project.
Editing a Project
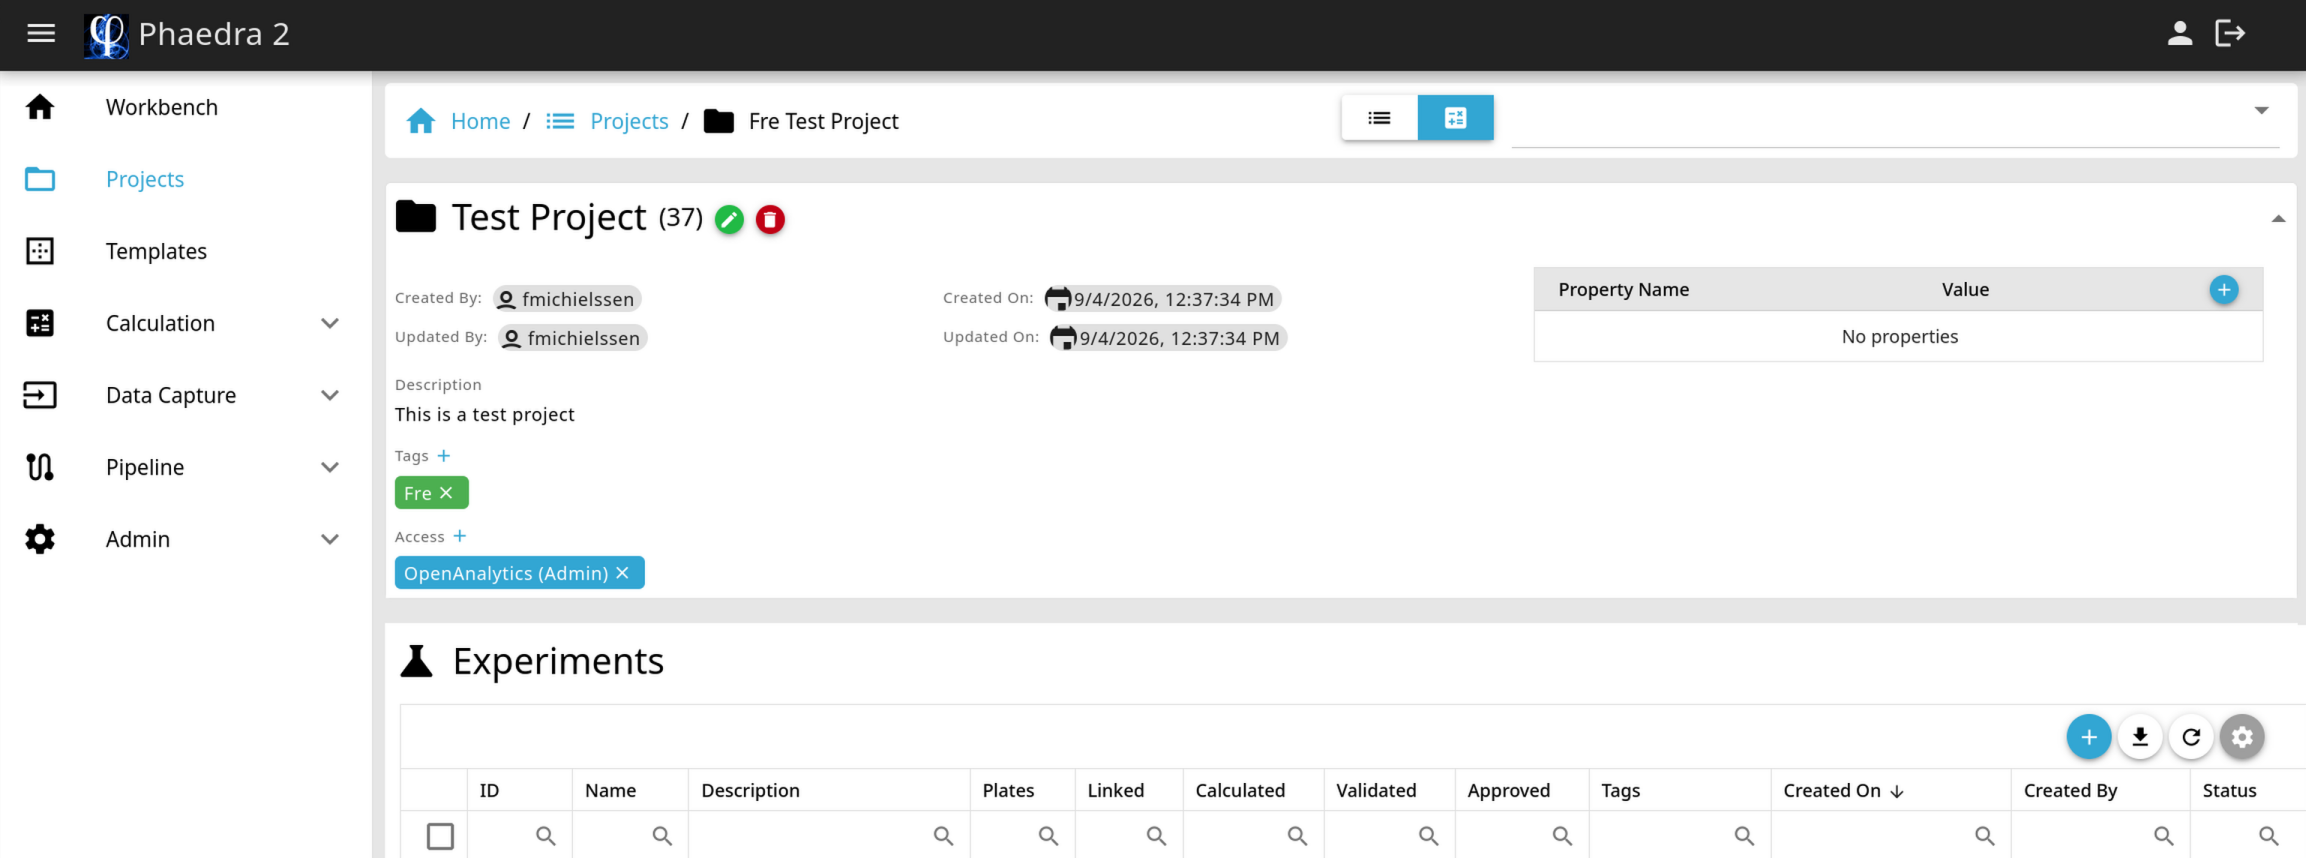
You can modify the project’s name, description, tags and properties, if you have the appropriate permissions. The Access field shows the teams that have Read, Write or Admin access on the project. If you don’t have Write or Admin access, you will not be able to edit the project.
- To edit the project name or description, click the Pencil button next to the project name.
- To add a tag, click the + button next to the Tags field. A tag is a simple label that can be attached to any project.
- To add a property, click the + button in the top right corner of the Properties table. A property is a Name-Value pair that can contain more detailed information than a tag.
Below the project’s general information section is another section listing the project’s Experiments.
Creating a New Experiment
To create a new Experiment, open a project and in the Experiments section, click on the blue + button (Create New Experiment) in the top right corner of the table.
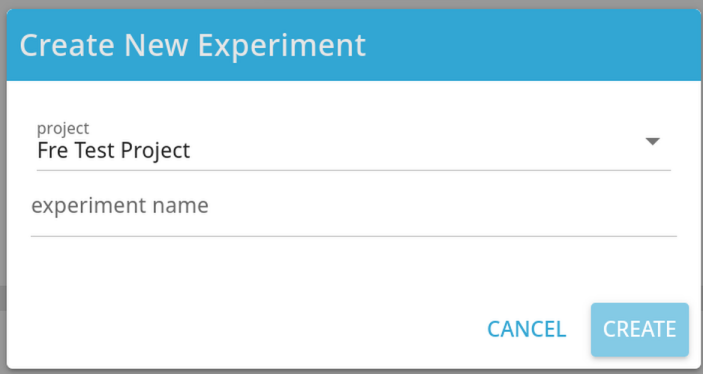
Enter a name for the new experiment and select Create.
Note: when using Pipelines, experiments (and plates) are often created automatically, and you don’t need to create them by hand.
Viewing an Experiment
All available experiments for a project are listed in the Experiments section of the project. If you have Read access to a project, you will automatically be able to see all the experiments in that project.
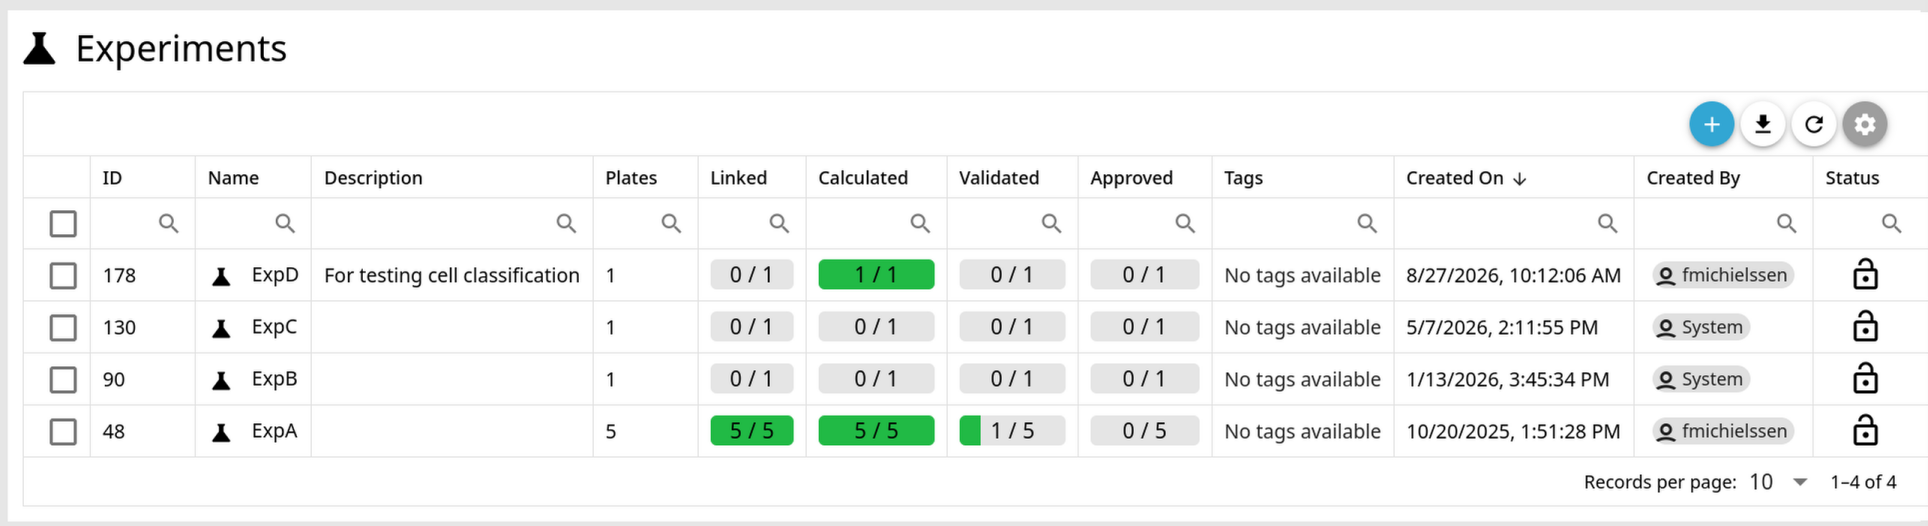
Double-click on any experiment to open it and see more details.
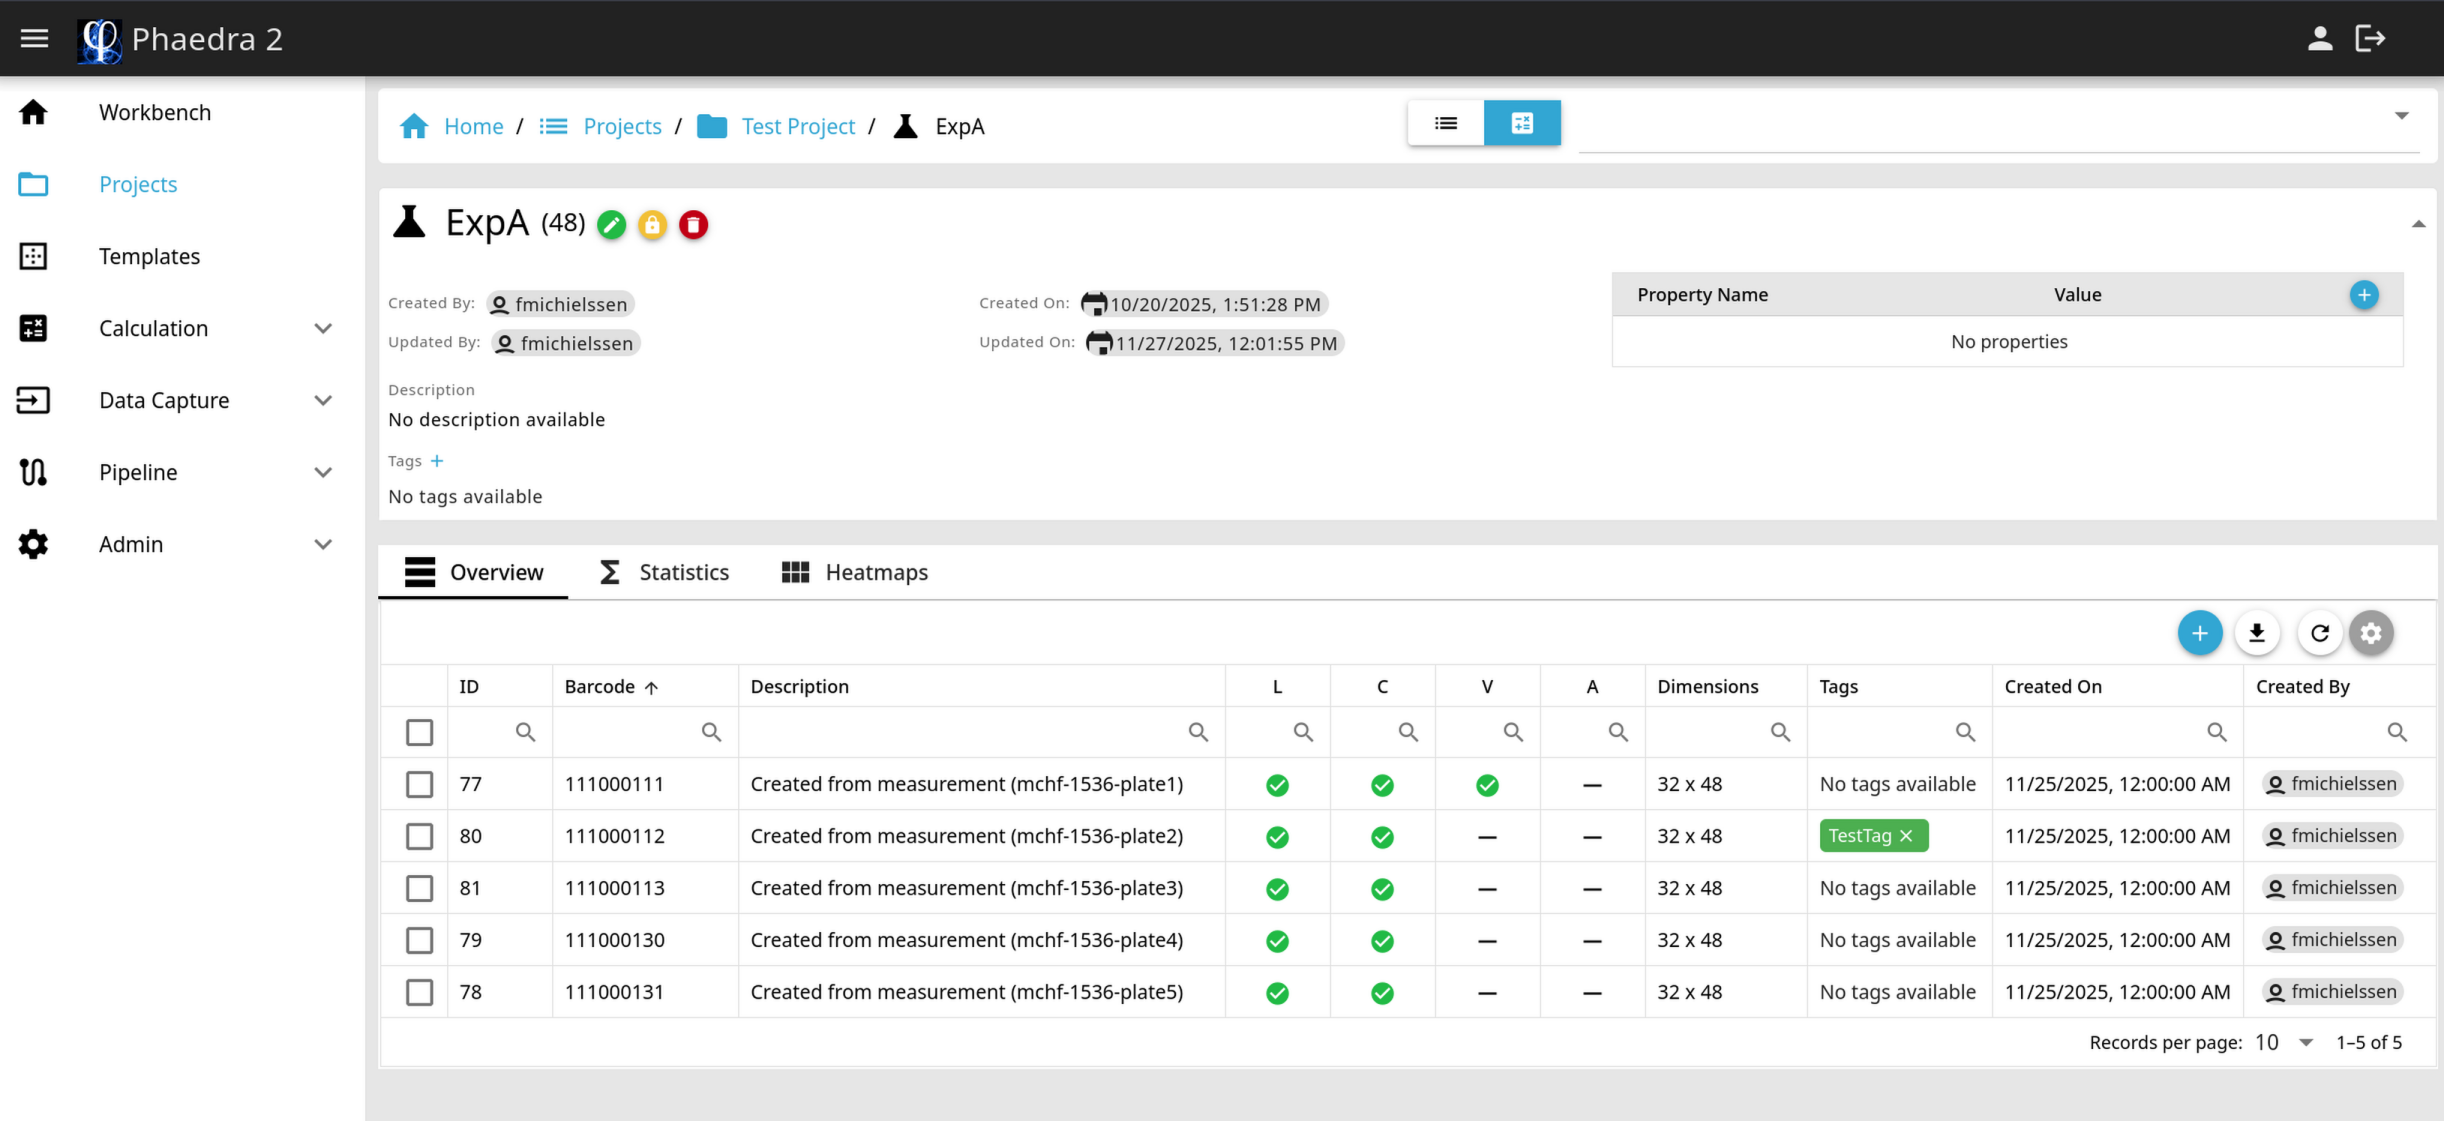
Just like the project view, the experiment view contains two sections:
- The first section displays general information about the experiment: the name, ID, creator info, description, tags and properties.
- The second section lists the plates this experiment contains. There are different ways to visualize the plates, depending on which tab you select: Overview, Statistics and Heatmaps.
Overview
The Overview tab lists the plates in a tabular format, showing general plate information as well as the plate validation status:
- L: Link status, showing a green checkmark if the plate has been linked with a plate definition
- C: Calculation status, showing a green checkmark if the plate has been calculated by at least one protocol
- V: Validation status, showing a green checkmark if the plate has been validated
- A: Approval status, showing a green checkmark if the plate has been approved
Statistics
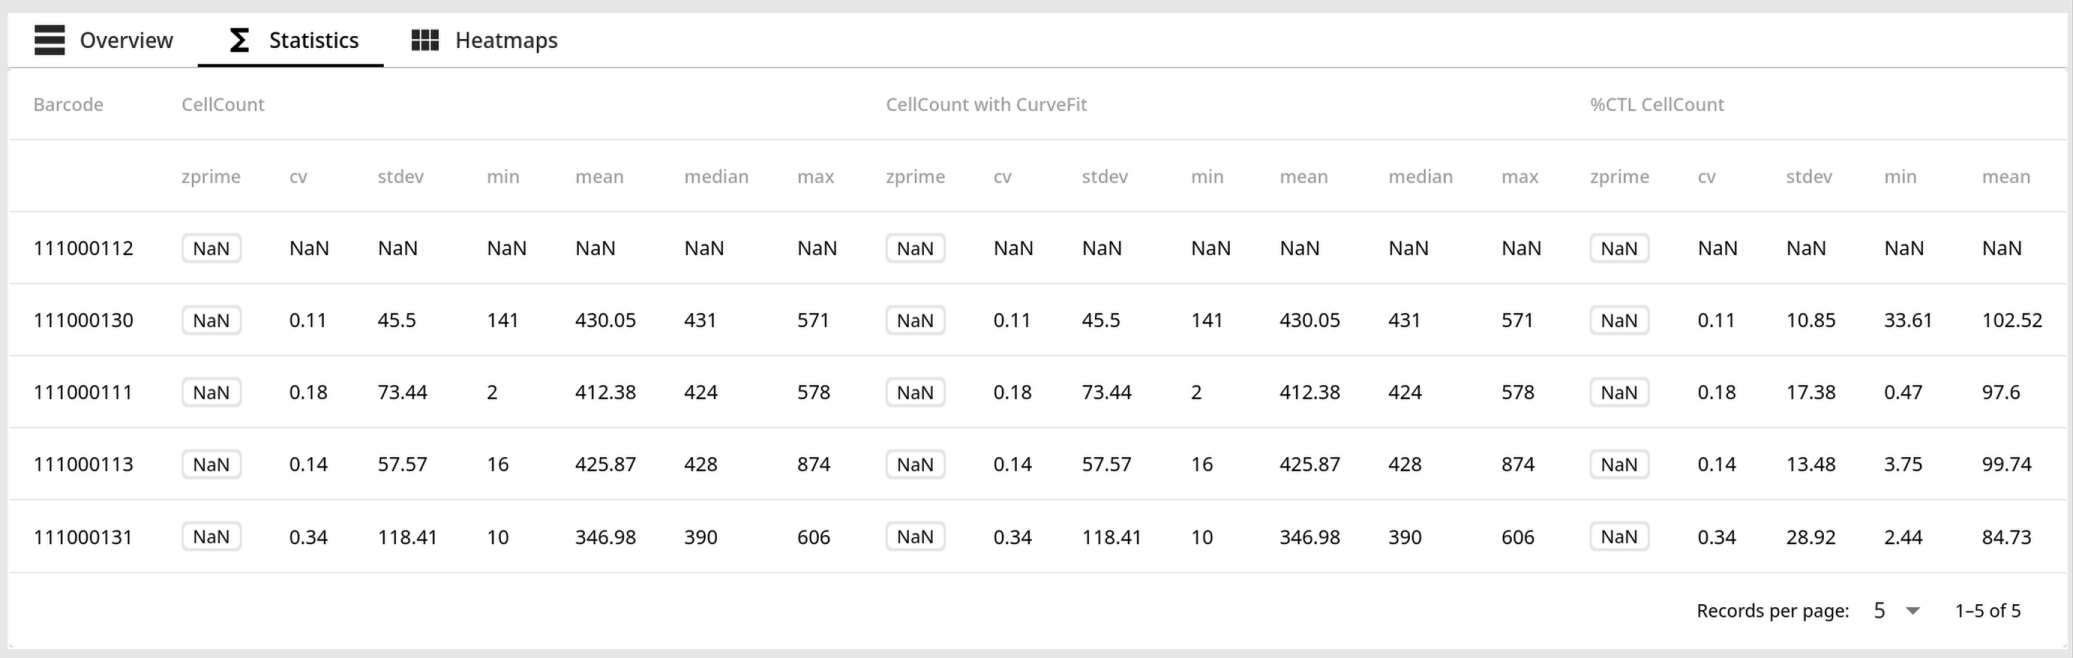
The Statistics tab also lists the plates in a tabular format, but adds statistical information about the feature data.
For each feature, several columns will appear displaying the primary statistics for that feature:
Heatmaps
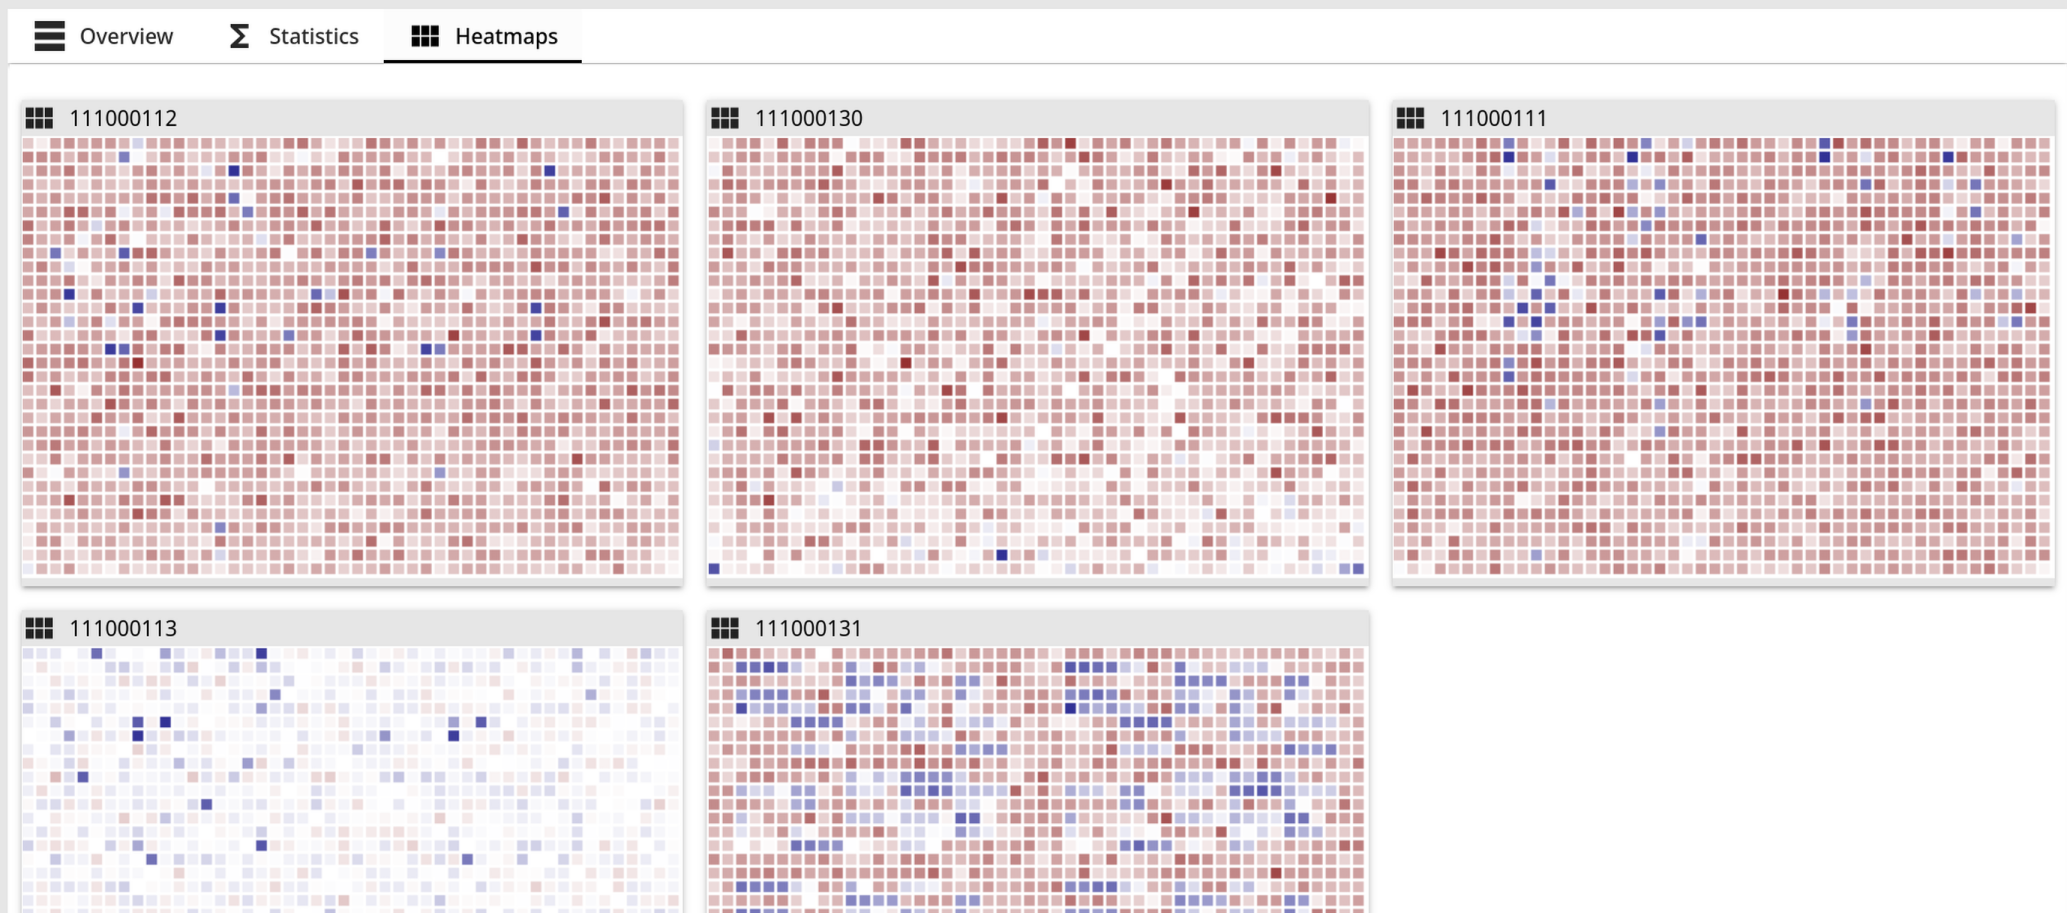
The Heatmaps tab shows small heatmaps for all the plates in a grid layout, allowing you to scroll through resultdata heatmaps of all the plates at once.
Editing an Experiment
If you have Write permissions on the project, you can modify experiment properties and contents using the experiment view:
- In the general section, you can rename the experiment, change the description, and add or remove tags and properties.
- In the plates section, you can create new plates, as explained below. In addition, you can perform various actions on the plates by selecting one or more plates, right-clicking, and choosing an action from the menu:
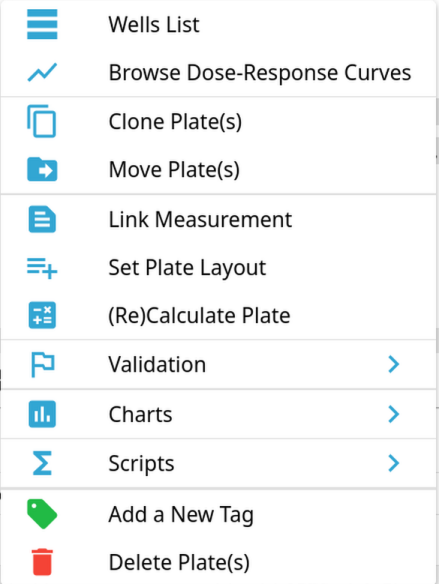
Note: these actions are explained further in the section Working with Plates.